




How It Works
01 — Before
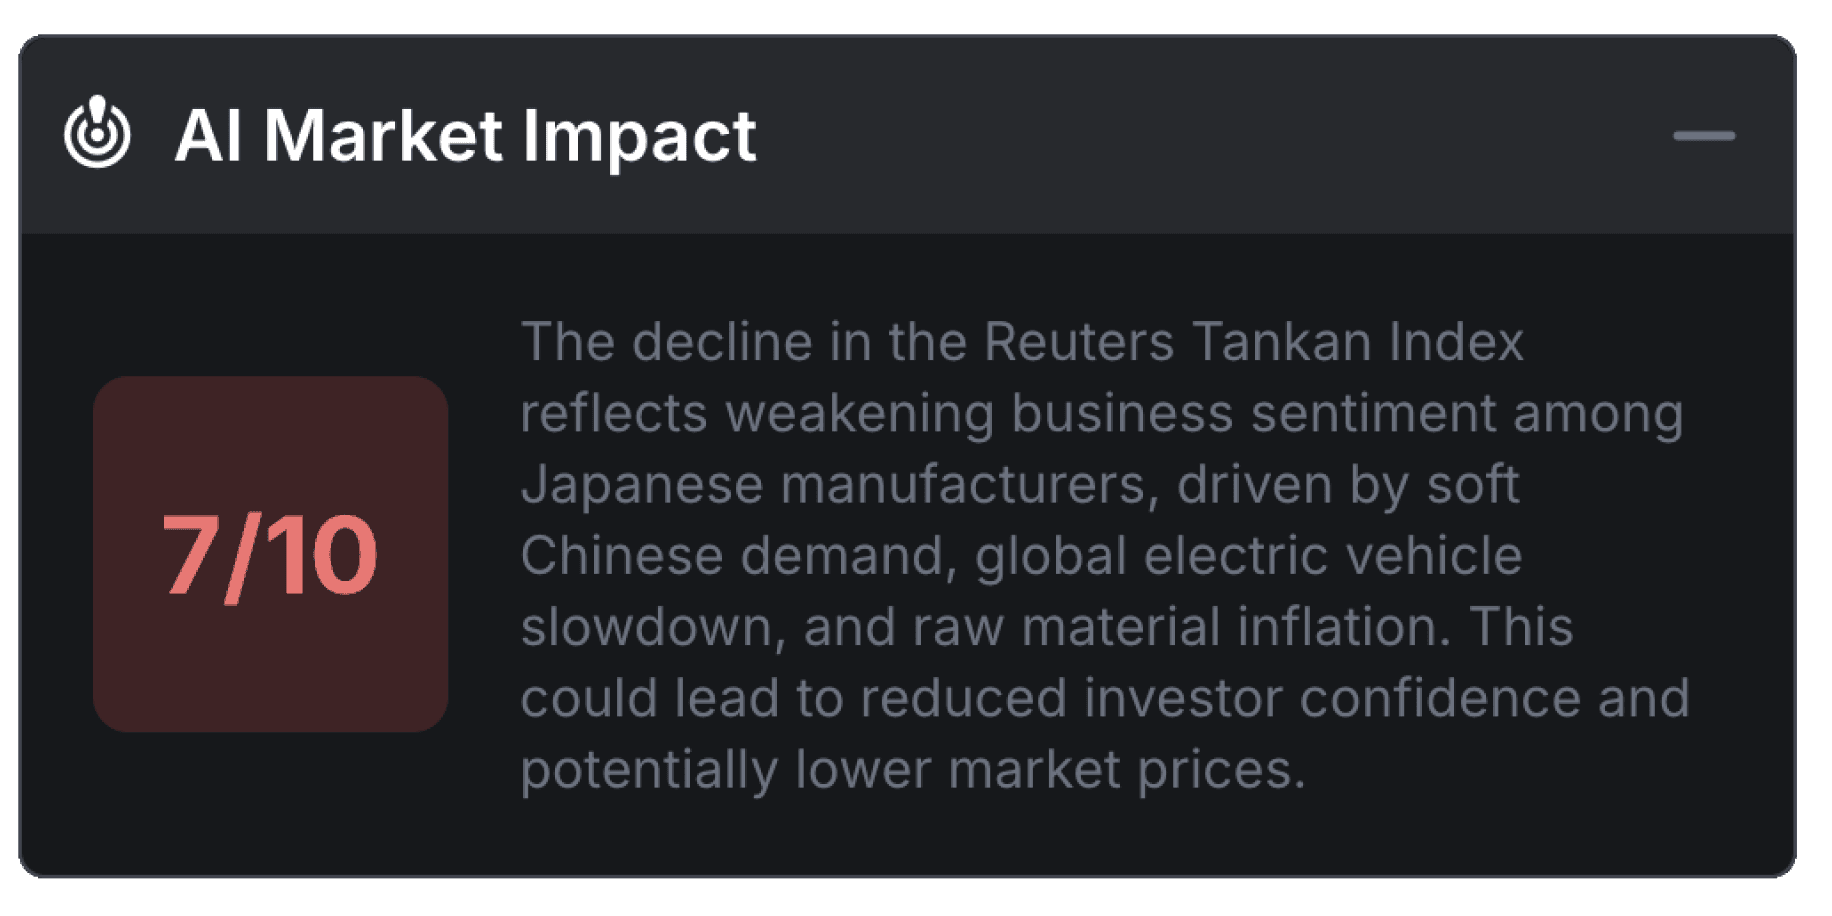
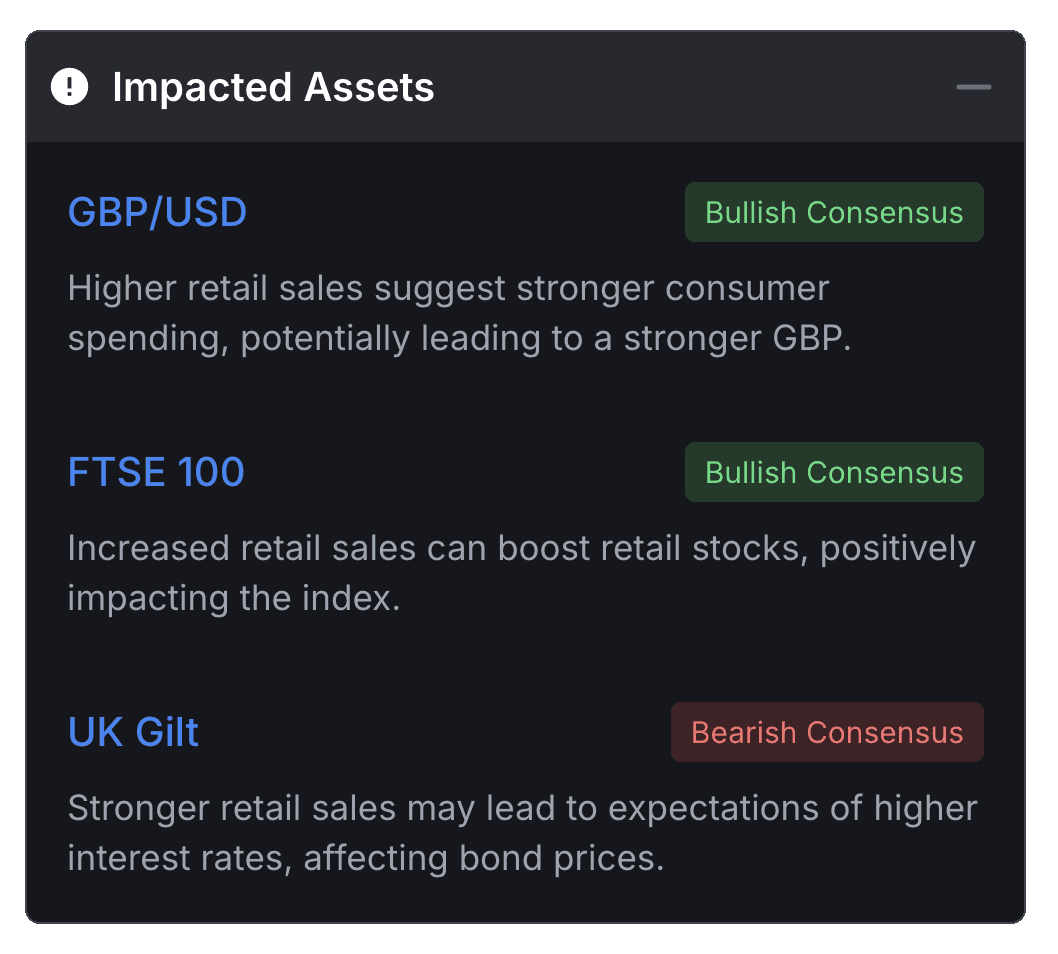
Economic and earnings calendars, AI impact scores, forecasts, filters, alerts, and upcoming-event chart overlays.

02 — During
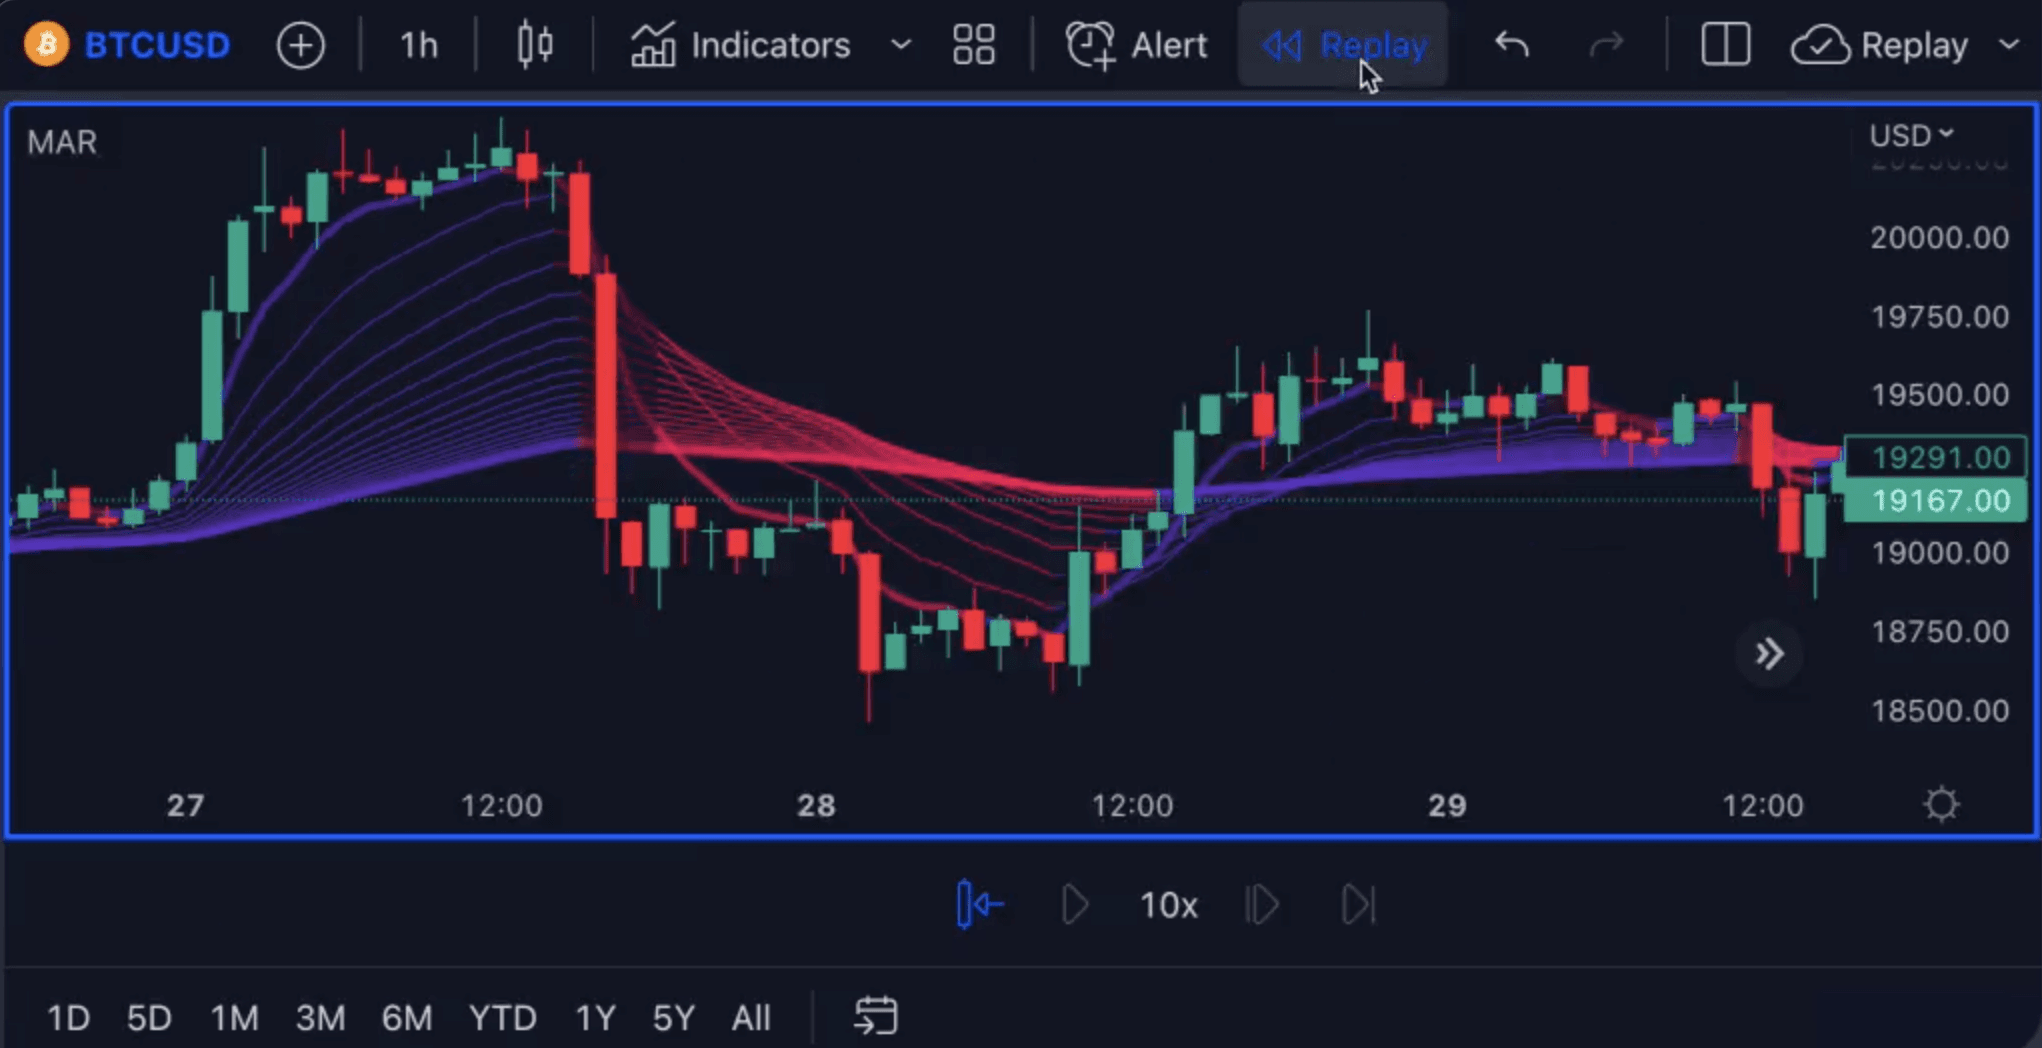
Asset-specific TradingView charts, immediate event context, and actual-versus-estimate results.
03 — After
AI post-event summaries and measured 5-minute, 15-minute, 1-hour, and 4-hour market reactions.
04 — Historically
Compare prior economic releases and earnings to understand volatility, direction, consistency, and sample size.
Based on historical market data · Not AI-generated
Platform Capabilities
From Catalyst to Market Reaction
LIVE
Based on historical market data · Not AI-generated


Built for Active Traders
Based on historical market data · Not AI-generated
Day Traders
Track catalyst timing and study measured 5-minute, 15-minute, 1-hour, and 4-hour reactions.
Stock Traders
Compare earnings actuals with estimates, identify beat or miss outcomes, and review historical stock reactions.
Futures Traders
Measure how economic events have affected NQ, ES, gold, and the U.S. dollar.
Forex Traders
Follow macro releases and central-bank events with forecasts, alerts, TradingView charts, and position-sizing tools.

Simple Pricing
One Platform for the Full Event Lifecycle


Earnings Intelligence
Compare EPS and revenue actuals with estimates, see whether a company beat, missed, or reported in line, and measure how the stock reacted after similar releases.
Actual vs Estimate • Beat/Miss Analysis • Historical Reactions • Verified Market Data
FAQ
What is GoMoon?
Who is GoMoon built for?
Which markets does GoMoon cover?
How does historical reaction analysis work?
What earnings data is included?
Does GoMoon provide trade signals or financial advice?
Is there a free trial?

GoMoon.ai
©2026 GoMoon.ai All rights reserved.
GoMoon provides market information and analytical tools for educational purposes only. It does not provide financial, investment, or trading advice. Trading involves risk.